NOTE: This initiative has ended, and as of May 2022, this webpage is no longer being updated regularly.
The world’s population is expected to grow to 9.6 billion by 2050, requiring an estimated 70–100% increase in food production.
But agricultural activities are affecting ecosystems, and the benefits they provide for people, more than ever before. There is an urgent need for better data and risk management tools that can guide decisions about agricultural development — and ensure that this development protects both people and nature.
Launched in Africa with a grant from the Bill & Melinda Gates Foundation to Conservation International, Vital Signs provides near real-time data and diagnostic tools to leaders around the world to help inform agricultural decisions and monitor their outcomes. This program is led by Conservation International in partnership with the Earth Institute at Columbia University and the Council for Scientific and Industrial Research in South Africa.
Our plan
Collect better data
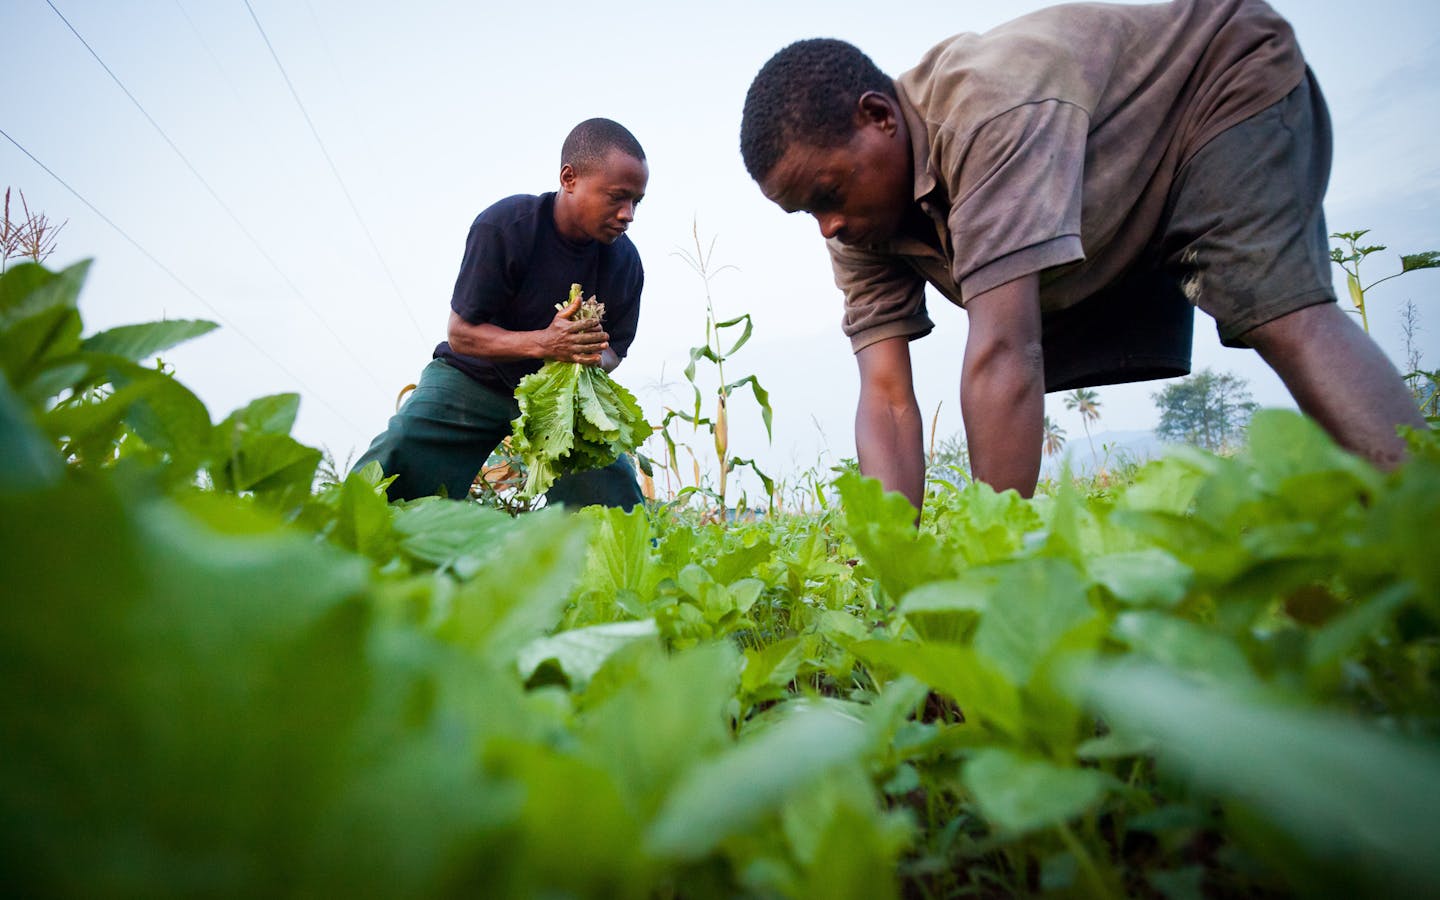
Using local field teams, Vital Signs gathers on-the-ground measurements of several different indicators of sustainability. In each country where the program works, these measurements help to create an accurate picture of the relationship among agriculture, nature and human well-being. The indicators we measure include sustainable agricultural production, water availability and quality, soil health, biodiversity, carbon stocks, climate resilience, household income, nutrition and market access.
Inform development decisions
Vital Signs helps to minimize any unintended consequences of agriculture for nature. It provides the key data and the analytical tools that decision-makers need to evaluate trade‐offs, manage risk and inform decisions. By doing so, it influences policymakers to work toward resilient ecosystems and sustainable livelihoods for smallholder farmers.
Build national capacity
A key goal of Vital Signs is to increase local and national capacity for environmental monitoring among scientists, civil society, government leaders and the private sector — throughout Africa and the entire world. We are working to create a global public good: a freely accessible and transparent information resource.
By the numbers
Input from more than 60 African stakeholders
Vital Signs has gathered input on data and decision-support needs through a series of workshops in Tanzania, Ghana, Ethiopia and Uganda. Representatives from more than 60 African ministries, agencies, universities and nonprofits participated in these meetings.
Building relationships with local partners
Vital Signs operates by making grants to African organizations to implement the monitoring system in each country where the project works. From hiring local field teams to running projects on the ground, grantee organizations in Tanzania, Ghana and Uganda
are key partners in the success of Vital Signs.
Partners establish Vital Signs field offices in each country, and field teams travel to high-priority regions to collect data on agriculture, biodiversity and human well-being. Data collection
includes conducting household surveys, measuring soil nutrients and crop yields, and performing both rapid and in-depth assessments of land cover and water quality.
If our measurements are flawed, decisions may be distorted … those attempting to guide the economy and our societies are like pilots trying to steer a course without a reliable compass.
Stiglitz-Sen-Fitoussi Commission on the Measurement of Economic Performance and Social Progress
How can we feed 9.6 billion people and sustain the nature we need? Feeding the growing world population will require a 70 to 100 percent increase in food production through agricultural intensification. But the reality is that no country can achieve this goal if it doesn't also work to sustain nature -- the healthy soils, pollinators, fresh water and forests on which both agriculture and farmers depend. Vital Signs is a monitoring system for agriculture, nature and human well-being. The system is initially launching in six African countries -- Tanzania, Ghana, Uganda, Mozambique, Rwanda and Ethiopia -- with plans for expansion to other parts of Africa and the globe. Learn more at vitalsigns.org.


